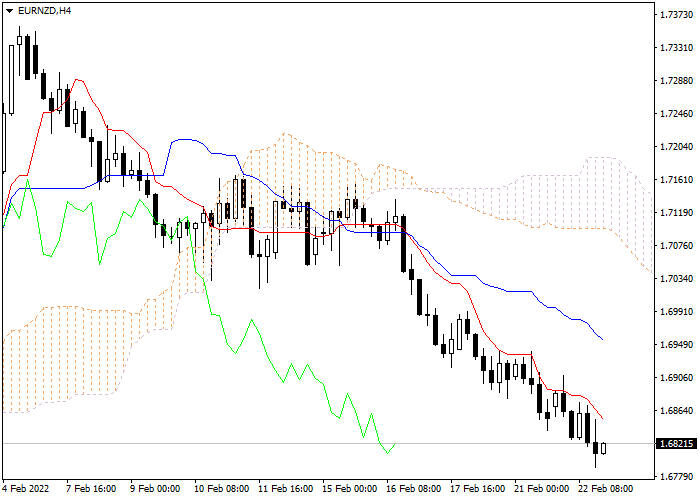
Let's look at the four-hour chart. Tenkan-sen line is below Kijun-sen, both lines are directed downwards. Confirmative line Chikou Span is below the price chart, current cloud is descending. The instrument is trading below Tenkan-sen and Kijun-sen lines; the Bearish trend is still strong. One of the previous minimums of Chikou Span line is expected to be a support level (1.6645). The closest resistance level is Kijun-sen line (1.6873).
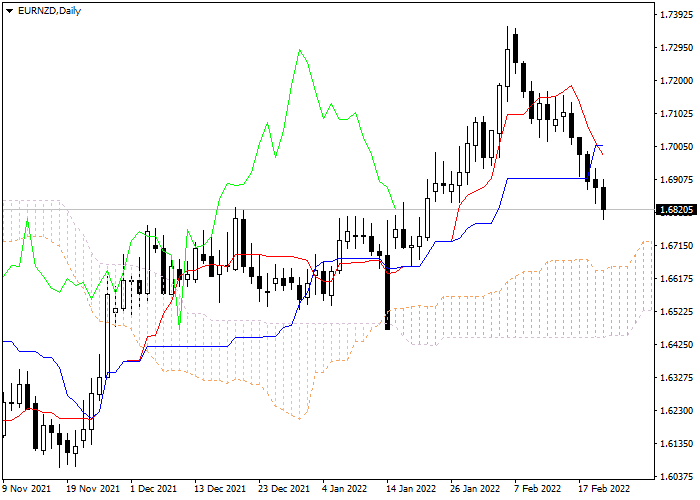
On the daily chart Tenkan-sen line is below Kijun-sen, the red line is directed downwards, while the blue one remains horizontal. Confirmative line Chikou Span is above the price chart, current cloud is ascending. The instrument is trading around upper border of the cloud. The closest support level is the upper border of the cloud (1.6648). The closest resistance level is Tenkan-sen line (1.7008).
On the four-hour chart the instrument is still falling. On the daily chart the Bullish trend is still strong. It is recommended to open short positions at current price with Take Profit at the level of previous minimum of Chikou Span line (1.6645) and Stop Loss at the level of Kijun-sen line (1.6873).
Euro vs New Zealand Dollar
| Mua | Bán | Mức chênh lệch |
| 1.99419 | 1.99284 | 135 |
Kịch bản
| Khung thời gian | Phạm vi trong ngày |
| Kiến nghị | SELL |
| Điểm Vào Lệnh | 1.6821 |
| Take Profit | 1.6645 |
| Stop Loss | 1.6873 |
| Các mức quan trọng | 1.6645, 1.6648, 1.6873, 1.7008 |
Trường hợp khác
| Kiến nghị | |
| Điểm Vào Lệnh | |
| Take Profit | |
| Stop Loss | |
| Các mức quan trọng |
Tài liệu được công bố trên trang này được sản xuất bởi Công ty Claws&Horns cùng với LiteFinance và không nên được coi là cung cấp lời khuyên đầu tư theo Chỉ thị 2014/65/EU; hơn nữa, tài liệu này không được chuẩn bị theo các yêu cầu pháp lý nhằm thúc đẩy tính độc lập của nghiên cứu đầu tư và không chịu bất kỳ hạn chế nào đối với việc giao dịch trước khi công bố nghiên cứu đó.